The graph below displays the number of homicides in the city of Flint, Michigan for each of the last three years. A reported interprets this graph to mean that the number of murders in 2010 was more Than twice the number of murders in 2008. Is the reporter making a correct interpretation? 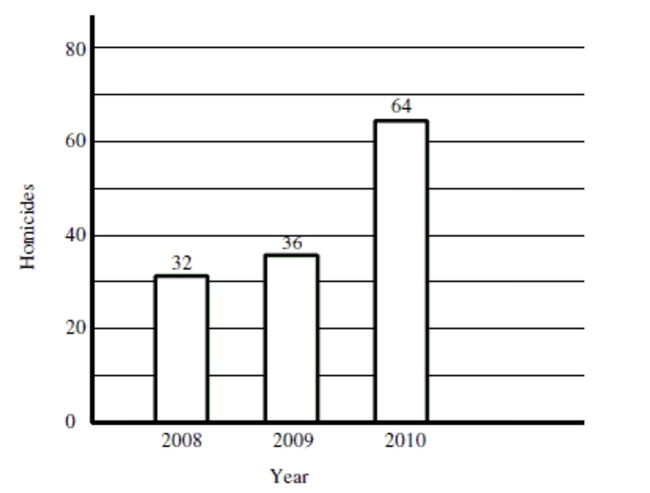
A) No. The width of the bars is identical, indicating that the number of murders in 2010 is no different from 2008.
B) There is not enough information given in the graph to determine whether the reporter's interpretation is correct or not.
C) Yes. The bar for 2010 is twice the height of the bar for 2008 and the number of murders indicated above the bars confirms that murders in 2010 were more than twice the level in 2008.
Correct Answer:
Verified
Q19: Based on the histogram below, would it
Q20: Choose the histogram that matches the description.
-The
Q21: Choose the histogram that matches the description.
-The
Q22: The graph below displays the number of
Q23: The histogram below is the distribution of
Q25: The histogram below displays the distribution of
Q27: Choose the histogram that matches the description.
-The
Q28: The distribution of the numbers of times
Q29: Data was collected on hand grip strength
Q37: In which category was there more variability
Unlock this Answer For Free Now!
View this answer and more for free by performing one of the following actions

Scan the QR code to install the App and get 2 free unlocks

Unlock quizzes for free by uploading documents