The histogram below displays the distribution of the length of time on hold, for a collection of customers, calling a repair call center. Use the histogram to select the true statement. 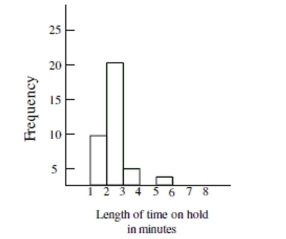
A) The distribution shows that the data was highly variable with some callers waiting on hold as
Many as 20 minutes.
B) The distribution is symmetrical. The number of callers who waited on hold for less than three
Minutes was the same as the number of callers who waited on hold for more than three
Minutes.
C) The distribution is left-skewed and most callers waited on hold at least three minutes.
D) The distribution is right-skewed and most callers waited on hold less than three minutes.
Correct Answer:
Verified
Q20: Choose the histogram that matches the description.
-The
Q21: Choose the histogram that matches the description.
-The
Q22: The graph below displays the number of
Q23: The histogram below is the distribution of
Q24: The graph below displays the number of
Q26: What is the mode response for 2001?
A)No
Q27: Choose the histogram that matches the description.
-The
Q28: The distribution of the numbers of times
Q29: Data was collected on hand grip strength
Q37: In which category was there more variability
Unlock this Answer For Free Now!
View this answer and more for free by performing one of the following actions

Scan the QR code to install the App and get 2 free unlocks

Unlock quizzes for free by uploading documents