The graph in the figure represents the velocity of a particle as it travels along the x-axis.
What is the average acceleration of the particle between t = 2.0 s and t = 4.0 s? 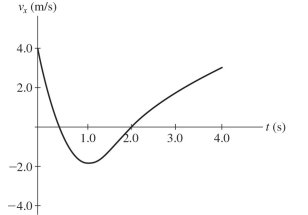
Correct Answer:
Verified
Q83: To determine the height of a bridge
Q84: A toy rocket is launched vertically from
Q85: An astronaut stands by the rim of
Q86: A rock is thrown directly upward from
Q87: A ball is thrown straight upward from
Q89: A package is dropped from a helicopter
Q90: At the same moment, one rock is
Q91: An astronaut stands by the rim of
Q92: An object is thrown upwards with a
Q93: A toy rocket is launched vertically from
Unlock this Answer For Free Now!
View this answer and more for free by performing one of the following actions

Scan the QR code to install the App and get 2 free unlocks

Unlock quizzes for free by uploading documents