The graph in the figure shows the velocity of a particle as it travels along the x-axis. What is the magnitude of the average acceleration of the particle between t = 1.0 s and t = 4.0 s? 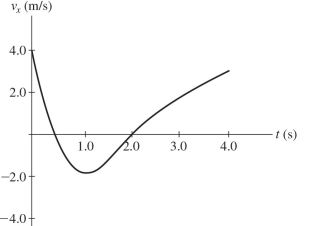
A) 
B) 
C) 
D) 
E) 
Correct Answer:
Verified
Q110: The figure shows a graph of the
Q111: If the velocity of an object is
Q112: Which of the following quantities has units
Q113: The graph in the figure shows the
Q114: The graph in the figure shows the
Q116: Which of the following quantities has units
Q117: Consider a deer that runs from point
Q118: You drive 6.0 km at 50 km/h
Q119: The graph in the figure shows the
Q120: Which of the following situations is impossible?
A)
Unlock this Answer For Free Now!
View this answer and more for free by performing one of the following actions

Scan the QR code to install the App and get 2 free unlocks

Unlock quizzes for free by uploading documents