The graph in the figure shows the position of a particle as it travels along the x-axis. What is the magnitude of the average speed of the particle between t = 1.0 s and t = 4.0 s? 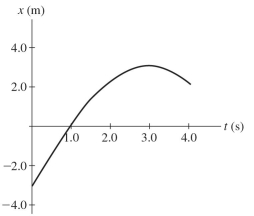
A) 0.67 m/s
B) 0.25 m/s
C) 0.50 m/s
D) 1.3 m/s
E) 1.0 m/s
Correct Answer:
Verified
Q108: If the velocity of an object is
Q109: The graph in the figure shows the
Q110: The figure shows a graph of the
Q111: If the velocity of an object is
Q112: Which of the following quantities has units
Q114: The graph in the figure shows the
Q115: The graph in the figure shows the
Q116: Which of the following quantities has units
Q117: Consider a deer that runs from point
Q118: You drive 6.0 km at 50 km/h
Unlock this Answer For Free Now!
View this answer and more for free by performing one of the following actions

Scan the QR code to install the App and get 2 free unlocks

Unlock quizzes for free by uploading documents