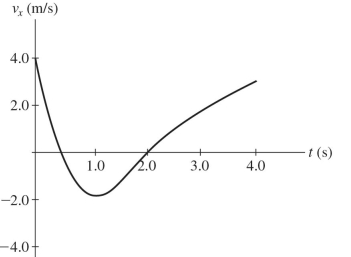
The graph in the figure shows the velocity of a particle as it travels along the x -axis. (a) In what direction (+x or -x) is the acceleration at t=0.5 s?
(b) In what direction ( +x or -x ) is the acceleration at t=3.0 s?
(c) What is the average acceleration of the particle between t=2.0 s and t=4.0 s ?
(d) At what value of t is the instantaneous acceleration equal to  ?
?
Correct Answer:
Verified
(b) +x
(c...
View Answer
Unlock this answer now
Get Access to more Verified Answers free of charge
Q104: The figure shows a graph of the
Q105: The figure shows a graph of the
Q106: Consider a car that travels between points
Q107: If the acceleration of an object is
Q108: If the velocity of an object is
Q110: The figure shows a graph of the
Q111: If the velocity of an object is
Q112: Which of the following quantities has units
Q113: The graph in the figure shows the
Q114: The graph in the figure shows the
Unlock this Answer For Free Now!
View this answer and more for free by performing one of the following actions

Scan the QR code to install the App and get 2 free unlocks

Unlock quizzes for free by uploading documents