The figure shows a graph of the position of a moving object as a function of time.
(a) What is the average velocity of the object from t = 0 s to t = 4.0 s?
(b) What is the average velocity of the object from t = 0 s to t = 6.0 s? 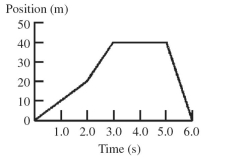
Correct Answer:
Verified
View Answer
Unlock this answer now
Get Access to more Verified Answers free of charge
Q100: An object is thrown upwards with a
Q101: The figure shows a graph of the
Q102: Suppose that an object travels from one
Q103: The graph in the figure shows the
Q104: The figure shows a graph of the
Q106: Consider a car that travels between points
Q107: If the acceleration of an object is
Q108: If the velocity of an object is
Q109: The graph in the figure shows the
Q110: The figure shows a graph of the
Unlock this Answer For Free Now!
View this answer and more for free by performing one of the following actions

Scan the QR code to install the App and get 2 free unlocks

Unlock quizzes for free by uploading documents