A normal probability plot is given below for a sample of scores on an aptitude test. Use the plot to assess the normality of scores on this test. Explain your reasoning. 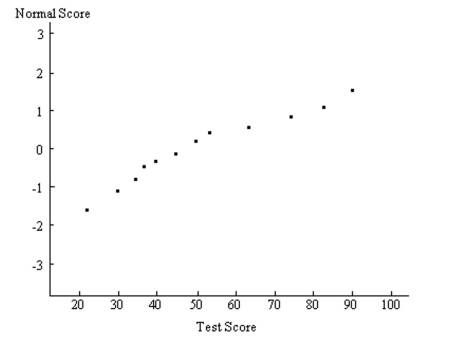
Correct Answer:
Verified
View Answer
Unlock this answer now
Get Access to more Verified Answers free of charge
Q160: Find the probability that in 200 tosses
Q161: Construct a normal probability plot of
Q162: Construct a normal probability plot of
Q163: Construct a normal probability plot of
Q164: Construct a normal probability plot of
Q166: In a certain population, 10% of people
Q167: Construct a normal probability plot of
Q168: A normal probability plot is given below
Q169: A normal probability plot is given below
Q170: A normal probability plot is given below
Unlock this Answer For Free Now!
View this answer and more for free by performing one of the following actions

Scan the QR code to install the App and get 2 free unlocks

Unlock quizzes for free by uploading documents