A normal probability plot is given below for the weekly incomes (in dollars)of a sample of engineers in one town. Use the plot to assess the normality of the incomes of engineers in this town. Explain your reasoning. 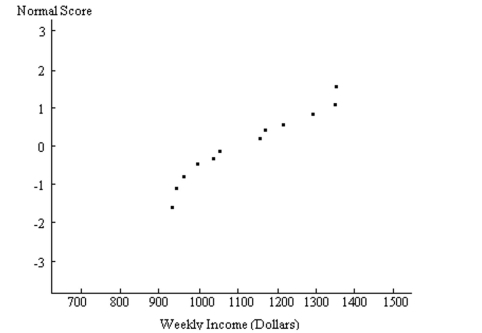
Correct Answer:
Verified
View Answer
Unlock this answer now
Get Access to more Verified Answers free of charge
Q163: Construct a normal probability plot of
Q164: Construct a normal probability plot of
Q165: A normal probability plot is given below
Q166: In a certain population, 10% of people
Q167: Construct a normal probability plot of
Q169: A normal probability plot is given below
Q170: A normal probability plot is given below
Q171: A baseball player has a batting average
Q172: Construct a normal probability plot of
Q173: Construct a normal probability plot of
Unlock this Answer For Free Now!
View this answer and more for free by performing one of the following actions

Scan the QR code to install the App and get 2 free unlocks

Unlock quizzes for free by uploading documents