Use the circle graph to solve the problem.
-A survey of the 4960 vehicles on the campus of State University yielded the following pie chart. 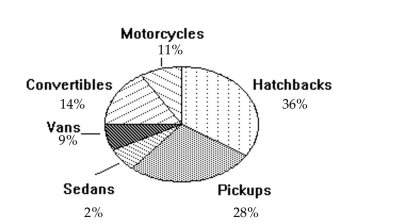 Together, what percent of the vehicles are either vans or convertibles?
A) 5%
B) 23%
C) 14%
D) 126%
Correct Answer:
Verified
Q38: Provide an appropriate response.
-Consider the frequency
Q39: Provide an appropriate response.
-Sturges' guideline suggests that
Q40: Solve the problem.
-Construct a frequency distribution and
Q41: Use the circle graph to solve
Q42: Construct the cumulative frequency distribution that
Q44: Use the circle graph to solve the
Q45: Find the original data from the
Q46: Use the circle graph to solve the
Q47: Construct the cumulative frequency distribution that
Q48: Construct the cumulative frequency distribution that
Unlock this Answer For Free Now!
View this answer and more for free by performing one of the following actions

Scan the QR code to install the App and get 2 free unlocks

Unlock quizzes for free by uploading documents