Use the circle graph to solve the problem.
-The pie chart below gives the number of students in the residence halls at the state university. 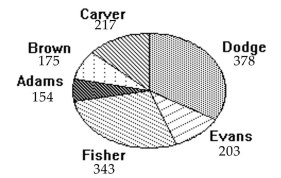
Write the ratio of the number of residents at Fisher to the number of students at Carver.
A)
B)
C)
D)
Correct Answer:
Verified
Q36: Use the given data to construct
Q37: Construct the relative frequency distribution that
Q38: Provide an appropriate response.
-Consider the frequency
Q39: Provide an appropriate response.
-Sturges' guideline suggests that
Q40: Solve the problem.
-Construct a frequency distribution and
Q42: Construct the cumulative frequency distribution that
Q43: Use the circle graph to solve the
Q44: Use the circle graph to solve the
Q45: Find the original data from the
Q46: Use the circle graph to solve the
Unlock this Answer For Free Now!
View this answer and more for free by performing one of the following actions

Scan the QR code to install the App and get 2 free unlocks

Unlock quizzes for free by uploading documents