Use the graph to answer the question. 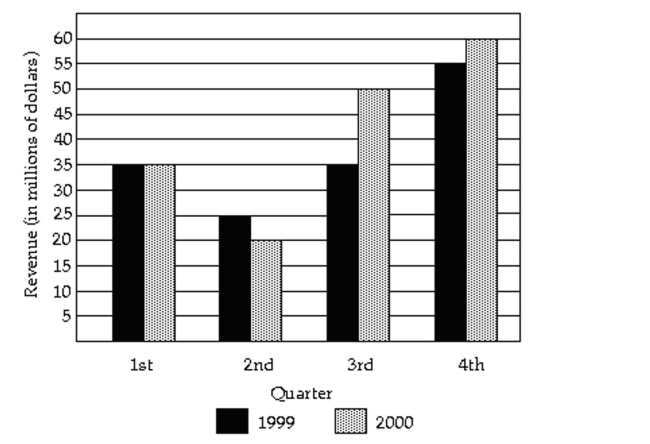
-Listed below are the ACT scores of 40 randomly selected students at a major university. a) Construct a relative frequency bar graph of the data, using eight classes. b) If the university wants to accept the top 90% of the applicants, what should the minimum score be c) If the university sets the minimum score at 17, what percent of the applicants will be accepted
Correct Answer:
Verified
b...
View Answer
Unlock this answer now
Get Access to more Verified Answers free of charge
Q5: The preschool children at Elmwood Elementary
Q6: Use the graph to answer the
Q7: Use the graph to answer the question.
Q8: The pie chart shows the percentage of
Q9: The pie chart shows the percentage of
Q11: Use the graph to answer the question.
Q12: Retailers are always interested in determining
Q13: Relative frequency is the proportion (or
Q14: The 1995 payroll amounts for all
Q15: Use the graph to answer the
Unlock this Answer For Free Now!
View this answer and more for free by performing one of the following actions

Scan the QR code to install the App and get 2 free unlocks

Unlock quizzes for free by uploading documents