The pie chart shows the percentage of votes received by each candidate in the student council presidential election. Use
the pie chart to answer the question.
-Student Council President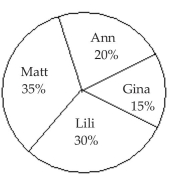
300 total votes Who got the fewest votes
A) Gina
B) Lili
C) Ann
D) Matt
Correct Answer:
Verified
Q3: The pie chart shows the percentage of
Q4: The Excel frequency bar graph below
Q5: The preschool children at Elmwood Elementary
Q6: Use the graph to answer the
Q7: Use the graph to answer the question.
Q9: The pie chart shows the percentage of
Q10: Use the graph to answer the
Q11: Use the graph to answer the question.
Q12: Retailers are always interested in determining
Q13: Relative frequency is the proportion (or
Unlock this Answer For Free Now!
View this answer and more for free by performing one of the following actions

Scan the QR code to install the App and get 2 free unlocks

Unlock quizzes for free by uploading documents