The pie chart shows the percentage of votes received by each candidate in the student council presidential election. Use
the pie chart to answer the question.
-A study was conducted to determine how people get jobs. Four hundred subjects were randomly selected and the results are listed below. Round percents to whole numbers. 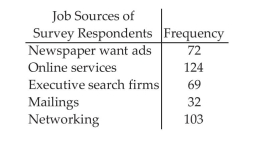
Correct Answer:
Verified
Q1: The bar graph below shows the
Q2: Scott Tarnowski owns a pet grooming
Q4: The Excel frequency bar graph below
Q5: The preschool children at Elmwood Elementary
Q6: Use the graph to answer the
Q7: Use the graph to answer the question.
Q8: The pie chart shows the percentage of
Q9: The pie chart shows the percentage of
Q10: Use the graph to answer the
Q11: Use the graph to answer the question.
Unlock this Answer For Free Now!
View this answer and more for free by performing one of the following actions

Scan the QR code to install the App and get 2 free unlocks

Unlock quizzes for free by uploading documents