The Excel frequency bar graph below describes the employment status of a random sample of U.S. adults. What is the percentage of those having no job 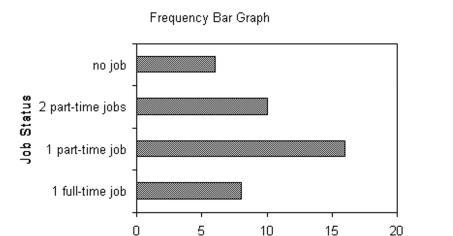
A)
B)
C)
D) cannot determine The following double-bar graph illustrates the revenue for a company for the four quarters of the year for two different years.
Correct Answer:
Verified
Q1: The bar graph below shows the
Q2: Scott Tarnowski owns a pet grooming
Q3: The pie chart shows the percentage of
Q5: The preschool children at Elmwood Elementary
Q6: Use the graph to answer the
Q7: Use the graph to answer the question.
Q8: The pie chart shows the percentage of
Q9: The pie chart shows the percentage of
Q10: Use the graph to answer the
Q11: Use the graph to answer the question.
Unlock this Answer For Free Now!
View this answer and more for free by performing one of the following actions

Scan the QR code to install the App and get 2 free unlocks

Unlock quizzes for free by uploading documents