Construct and Interpret Confidence Intervals about the Population Mean Difference of Matched -Pairs Data
-We are interested in comparing the average supermarket prices of two leading colas in the Tampa area. Our sample was taken by randomly going to each of eight supermarkets and recording the price of a six - pack of cola of each brand. The data are shown in the following table. Find a confidence interval for the difference in mean price of brand 1 and brand 2. Assume that the paired data came from a population that is normally distributed.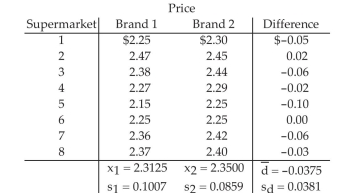
A)
B)
C)
D)
Correct Answer:
Verified
Q35: Test Hypotheses Regarding the Difference of
Q36: Test Hypotheses Regarding the Difference of
Q37: Construct and Interpret Confidence Intervals about
Q38: Test Hypotheses Regarding the Difference of
Q39: Construct and Interpret Confidence Intervals about the
Q41: Construct and Interpret Confidence Intervals Regarding
Q42: Test Hypotheses Regarding the Difference of
Q43: Test Hypotheses Regarding the Difference of
Q44: Test Hypotheses Regarding the Difference of Two
Q45: Test Hypotheses Regarding the Difference of
Unlock this Answer For Free Now!
View this answer and more for free by performing one of the following actions

Scan the QR code to install the App and get 2 free unlocks

Unlock quizzes for free by uploading documents