Construct and Interpret Confidence Intervals about the Population Mean Difference of Matched -Pairs Data
-A new weight-reducing technique, consisting of a liquid protein diet, is currently undergoing tests before its introduction into the market. A typical test performed is the following: The weights of a random sample of five people are recorded before they are introduced to the liquid protein diet. The five individuals are then instructed to follow the liquid protein diet for 3 weeks. At the end of this period, their weights (in pounds) are again recorded. The results are listed in the table. Let be the true mean weight of individuals before starting the diet and let be the true mean weight of individuals after 3 weeks on the diet. Calculate a confidence interval for the difference between the mean weights before and after the diet is used. Assume that the paired data came from a population that is normally distributed.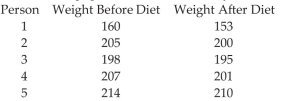
Summary information is as follows: .
Correct Answer:
Verified
View Answer
Unlock this answer now
Get Access to more Verified Answers free of charge
Q32: Test Hypotheses Regarding the Difference of
Q33: Test Hypotheses Regarding the Difference of
Q35: Test Hypotheses Regarding the Difference of
Q36: Test Hypotheses Regarding the Difference of
Q38: Test Hypotheses Regarding the Difference of
Q39: Construct and Interpret Confidence Intervals about the
Q40: Construct and Interpret Confidence Intervals about
Q41: Construct and Interpret Confidence Intervals Regarding
Q42: Test Hypotheses Regarding the Difference of
Q61: A study was conducted to determine if
Unlock this Answer For Free Now!
View this answer and more for free by performing one of the following actions

Scan the QR code to install the App and get 2 free unlocks

Unlock quizzes for free by uploading documents