Below are two histograms. One corresponds to the ages at which a sample of people applied for marriage licenses; the other corresponds to the last digit of a sample of social security numbers. Which graph is which, and why? 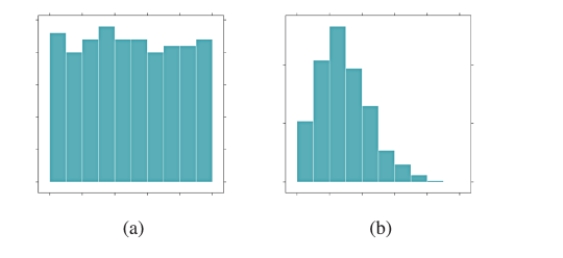
Correct Answer:
Verified
View Answer
Unlock this answer now
Get Access to more Verified Answers free of charge
Q8: Use the following information to answer questions
Q9: If you were to create a dotplot
Q10: for following questions , what would you
Q11: How is a dotplot similar to a
Q12: How would you describe the typical value
Q14: Use the word cloud to answer questions
Q15: The following histogram represents the number of
Q16: The bar charts below depict the MPAA
Q17: for following questions , what would you
Q18: Order the following histograms from least to
Unlock this Answer For Free Now!
View this answer and more for free by performing one of the following actions

Scan the QR code to install the App and get 2 free unlocks

Unlock quizzes for free by uploading documents