The bar charts below depict the MPAA movie ratings of 489 movies, separated by high and low critic scores. Which bar chart shows more variability in MPAA movie ratings? Why? 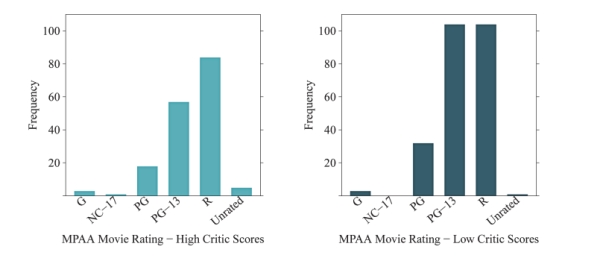
Correct Answer:
Verified
View Answer
Unlock this answer now
Get Access to more Verified Answers free of charge
Q11: How is a dotplot similar to a
Q12: How would you describe the typical value
Q13: Below are two histograms. One corresponds to
Q14: Use the word cloud to answer questions
Q15: The following histogram represents the number of
Q17: for following questions , what would you
Q18: Order the following histograms from least to
Q19: Using the following bar chart, what can
Q20: What is the difference between a bar
Q21: Which dotplot represents the same data as
Unlock this Answer For Free Now!
View this answer and more for free by performing one of the following actions

Scan the QR code to install the App and get 2 free unlocks

Unlock quizzes for free by uploading documents