The Fitness Center manager has collected data on the number of visits to the club each week for the past 8 weeks. These data are shown as follows. Which of the following statements is most correct? 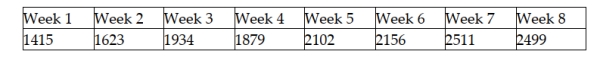
A) The proper graph for displaying these data is a pie chart.
B) There has been a gradual downward trend in these data.
C) A frequency histogram should be developed to help identify the trend in these data.
D) The data lend themselves to a line chart.
Correct Answer:
Verified
Q128: Suppose you are given the following data.
Q129: Assuming you have data for a variable
Q130: In creating a frequency distribution for numerical
Q131: Consider the following chart. Which of the
Q132: Suppose that you have a data set
Q133: Discuss the steps that you would use
Q134: Explain why a relative frequency histogram is
Q136: Explain why it is appropriate to connect
Q137: A company has 400 employees. The manager
Q138: Consider the following chart. Which of the
Unlock this Answer For Free Now!
View this answer and more for free by performing one of the following actions

Scan the QR code to install the App and get 2 free unlocks

Unlock quizzes for free by uploading documents