Consider the following chart. Which of the following statements is most correct? 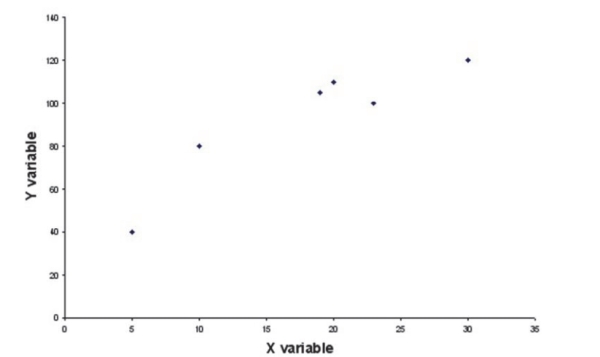
A) There is a negative linear relationship between the two variables.
B) There is a positive linear relationship between the two variables.
C) There is a perfect linear relationship between the two variables.
D) There is no apparent relationship between the two variables.
Correct Answer:
Verified
Q128: Suppose you are given the following data.
Q129: Assuming you have data for a variable
Q130: In creating a frequency distribution for numerical
Q131: Consider the following chart. Which of the
Q132: Suppose that you have a data set
Q133: Discuss the steps that you would use
Q134: Explain why a relative frequency histogram is
Q135: The Fitness Center manager has collected data
Q136: Explain why it is appropriate to connect
Q137: A company has 400 employees. The manager
Unlock this Answer For Free Now!
View this answer and more for free by performing one of the following actions

Scan the QR code to install the App and get 2 free unlocks

Unlock quizzes for free by uploading documents