Linear regression was used to describe the trend in world population over time.Below is a plot of the residuals versus predicted values.What does the plot of residuals suggest? 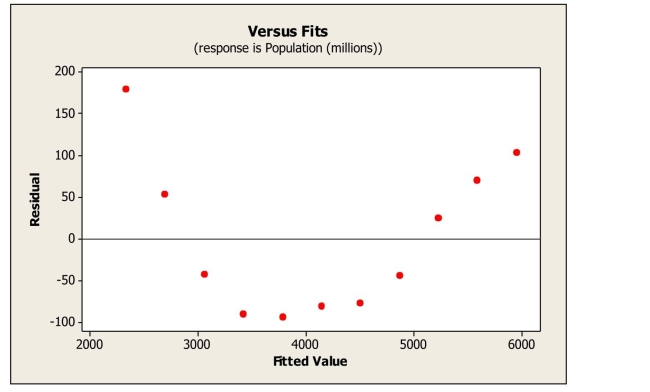
A) An outlier is present in the data set.
B) The linearity condition is not satisfied.
C) A high leverage point is present in the data set.
D) The data are not normal.
E) The equal spread condition is not satisfied.
Correct Answer:
Verified
Q3: Which statement about residuals plots is true?
I.A
Q8: Which of the following is not a
Q8: The model Q9: A residuals plot is useful because Q10: Over the past decade a farmer has Q11: When using midterm exam scores to predict Q12: A residual plot that has no pattern Q13: A scatterplot of log(Y) vs.log(X) reveals a Q15: Which is true? Q16: Another farmer has increased his wheat production
I.it will
I. Random scatter in
Unlock this Answer For Free Now!
View this answer and more for free by performing one of the following actions

Scan the QR code to install the App and get 2 free unlocks

Unlock quizzes for free by uploading documents