This graph shows an interpretation of temperatures based on tree-ring data. This graph implies that: 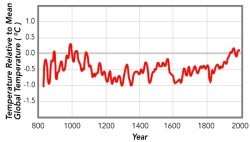
A) current temperatures are by far the hottest in this record
B) atmospheric warming started well before 1900
C) climate was stable prior to 1800
D) all of these
Correct Answer:
Verified
Q77: What is the main setting in which
Q78: How do rain forests influence ecology?
A) materials
Q79: Tropical rain forests are clustered near the
Q80: Where do most deserts and other arid
Q81: Between 1960 and 2010, atmospheric greenhouse CO2
Q83: Which of the following is NOT likely
Q84: Which of the following landscape features is
Q85: This plot of ice-core data shows measurements
Q86: These data, derived from ice cores, indicate
Q87: How does this desert feature form?
Unlock this Answer For Free Now!
View this answer and more for free by performing one of the following actions

Scan the QR code to install the App and get 2 free unlocks

Unlock quizzes for free by uploading documents