This plot of ice-core data shows measurements of CO2 content and interpretation of temperatures. These data show: 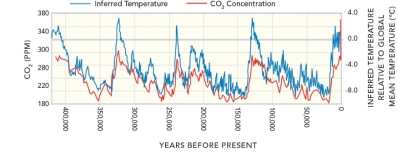
A) that CO2 concentration and temperature generally increase and decrease over the same time periods
B) that most temperature changes on this graph are due to CO2 introduced by humans
C) that current temperatures are the highest they have been
D) all of these
Correct Answer:
Verified
Q80: Where do most deserts and other arid
Q81: Between 1960 and 2010, atmospheric greenhouse CO2
Q82: This graph shows an interpretation of temperatures
Q83: Which of the following is NOT likely
Q84: Which of the following landscape features is
Q86: These data, derived from ice cores, indicate
Q87: How does this desert feature form?
Q88: This photograph shows an accumulation of calcium
Q89: Which of the following landscape features is
Q90: This graph shows an interpretation of temperatures
Unlock this Answer For Free Now!
View this answer and more for free by performing one of the following actions

Scan the QR code to install the App and get 2 free unlocks

Unlock quizzes for free by uploading documents