This graph shows an interpretation of temperatures based on the lengths of glaciers. This graph indicates that: 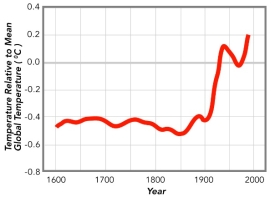
A) climate has been changing over the past hundred years
B) overall, air temperatures have been increasing since around 1900
C) from 1600 to 1900 the Earth was dramatically colder than it has been since 1900
D) all of these
Correct Answer:
Verified
Q85: This plot of ice-core data shows measurements
Q86: These data, derived from ice cores, indicate
Q87: How does this desert feature form?
Q88: This photograph shows an accumulation of calcium
Q89: Which of the following landscape features is
Q91: Pictured here is a model of how
Q92: Based on data collected in Hawaii, since
Q93: What desert feature is shown in this
Q94: What desert feature is shown in this
Q95: Which of the following is true about
Unlock this Answer For Free Now!
View this answer and more for free by performing one of the following actions

Scan the QR code to install the App and get 2 free unlocks

Unlock quizzes for free by uploading documents