This graph shows an interpretation of temperatures based on the change in isotopes in ice-core data. This graph implies that: 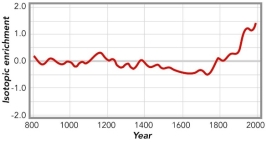
A) current temperatures are by far the hottest based on this record
B) atmospheric warming started as early as the late 1700s
C) the coolest time period on this data set was from around 1500 to the last part of the 1700s
D) all of these
Correct Answer:
Verified
Q91: Pictured here is a model of how
Q92: Based on data collected in Hawaii, since
Q93: What desert feature is shown in this
Q94: What desert feature is shown in this
Q95: Which of the following is true about
Q97: Which of the following landscape features is
Q98: Which of the following is NOT true
Q99: This graph shows one estimate of average
Q100: Which of the following is true about
Q101: Considering the history of Hurricane Sandy, what
Unlock this Answer For Free Now!
View this answer and more for free by performing one of the following actions

Scan the QR code to install the App and get 2 free unlocks

Unlock quizzes for free by uploading documents