This graph shows one estimate of average air temperatures. This graph indicates that: 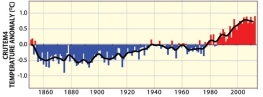
A) humans and greenhouse gases are responsible for global warming
B) overall, air temperatures have been increasing since around 1910
C) Earth was warmer in the late 1800s than it was in the late 1900s
D) all of these
Correct Answer:
Verified
Q94: What desert feature is shown in this
Q95: Which of the following is true about
Q96: This graph shows an interpretation of temperatures
Q97: Which of the following landscape features is
Q98: Which of the following is NOT true
Q100: Which of the following is true about
Q101: Considering the history of Hurricane Sandy, what
Q102: The accompanying graph shows the number of
Q103: Which of the following sites on this
Q104: Which of the following is a way
Unlock this Answer For Free Now!
View this answer and more for free by performing one of the following actions

Scan the QR code to install the App and get 2 free unlocks

Unlock quizzes for free by uploading documents