The accompanying graph shows the number of Atlantic hurricanes since the 1880's. Based on when most global warming has occurred, one would conclude: 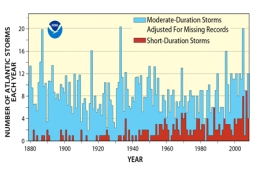
A) short duration hurricanes have increased in frequency.
B) all hurricanes have increased in frequency.
C) moderate duration hurricanes have increased in frequency.
D) no trends are apparent from this graph.
Correct Answer:
Verified
Q99: This graph shows one estimate of average
Q100: Which of the following is true about
Q101: Considering the history of Hurricane Sandy, what
Q102: The accompanying graph shows the number of
Q103: Which of the following sites on this
Q104: Which of the following is a way
Q105: Which of the following is NOT a
Q106: Which of the following received the most
Q108: Which of the following sites will be
Q109: Which of the following areas would most
Unlock this Answer For Free Now!
View this answer and more for free by performing one of the following actions

Scan the QR code to install the App and get 2 free unlocks

Unlock quizzes for free by uploading documents