Following is a pie chart that presents the percentages spent by a certain household on its five largest annual expenditures. What percentage of the money spent was spent on food, housing, and utilities? 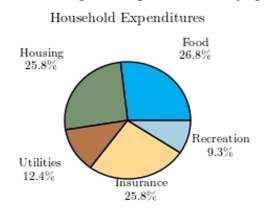
A) 52.6%
B) 65%
C) 61.9%
D) 50%
Correct Answer:
Verified
Q15: The following pie chart presents the percentages
Q16: The following frequency distribution presents the
Q17: The following frequency distribution presents the
Q18: The following table presents the purchase
Q19: Thirty households were surveyed for the
Q21: The amounts 5 and 2 are compared.
Q22: A sample of 200 high school
Q23: Following are the numbers of Dean's
Q24: Construct a stem-and-leaf plot for the
Q25: Gravity on Mars: The gravity on Earth
Unlock this Answer For Free Now!
View this answer and more for free by performing one of the following actions

Scan the QR code to install the App and get 2 free unlocks

Unlock quizzes for free by uploading documents