The following table presents the purchase totals (in dollars) of a random sample of gasoline purchases at a convenience store.
Construct a relative frequency histogram using a class width of 10, and using 0 as the lower class limit for the First class.
A) 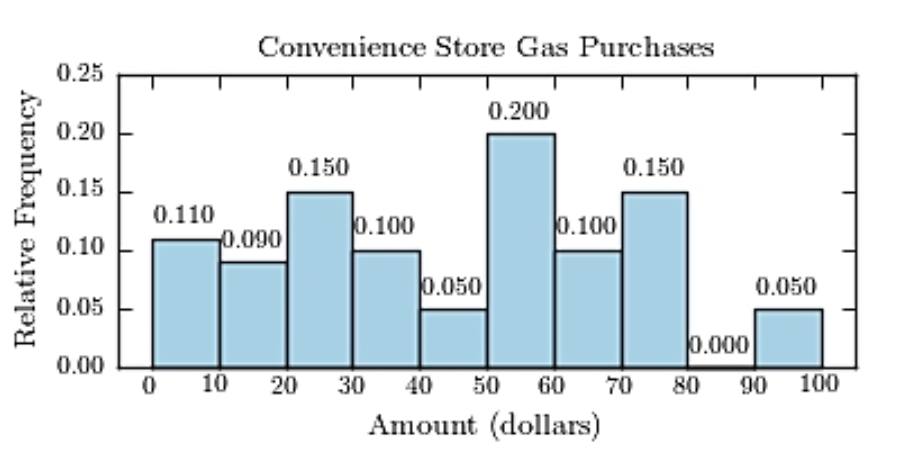
B) 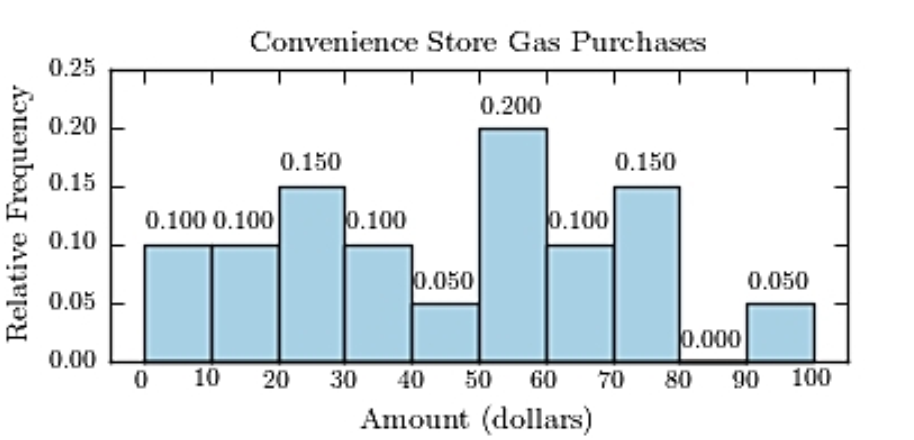
C) 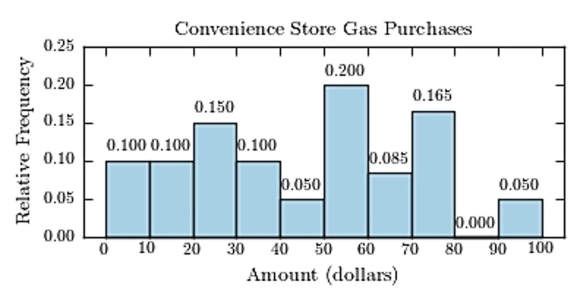
D) 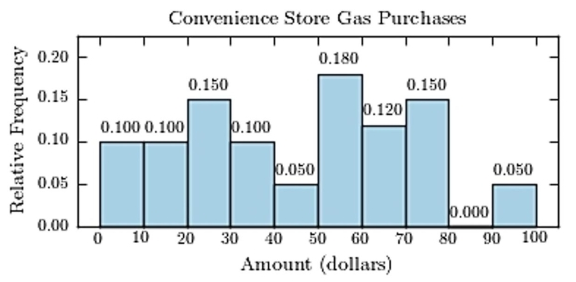
Correct Answer:
Verified
Q13: The following frequency distribution presents the
Q14: Classify the histogram as unimodal or bimodal.
Q15: The following pie chart presents the percentages
Q16: The following frequency distribution presents the
Q17: The following frequency distribution presents the
Q19: Thirty households were surveyed for the
Q20: Following is a pie chart that presents
Q21: The amounts 5 and 2 are compared.
Q22: A sample of 200 high school
Q23: Following are the numbers of Dean's
Unlock this Answer For Free Now!
View this answer and more for free by performing one of the following actions

Scan the QR code to install the App and get 2 free unlocks

Unlock quizzes for free by uploading documents