The following table presents the rate of population growth of a suburb of Atlanta, Georgia for each of the years 1990 through 2009. Construct a time-series plot of the growth rate.
A) 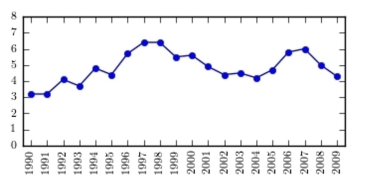
B) 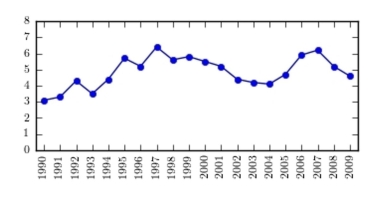
C) 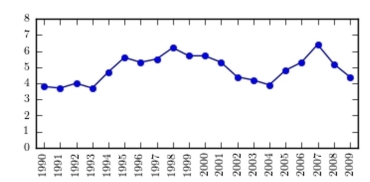
D) 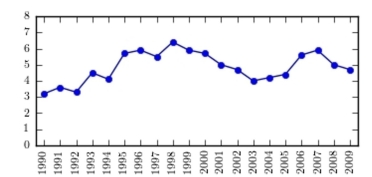
Correct Answer:
Verified
Q30: Helium prices: The cost of grade A
Q31: A sample of 200 high school
Q32: A sample of 200 high school
Q33: Toy sales: The following graph presents the
Q34: Chocolate or vanilla: The following bar graph
Q35: Construct a dotplot for the following
Q37: The amounts 3 and 4 are compared.
Q38: The amounts 3 and 2 are compared.
Q39: Construct a stem-and-leaf plot for the
Q40: The following time-series plot presents the population
Unlock this Answer For Free Now!
View this answer and more for free by performing one of the following actions

Scan the QR code to install the App and get 2 free unlocks

Unlock quizzes for free by uploading documents