Solve the problem.
-A normal quartile plot is given below for a sample of scores on an aptitude test. Use the plot to assess the
normality of scores on this test. Explain your reasoning. 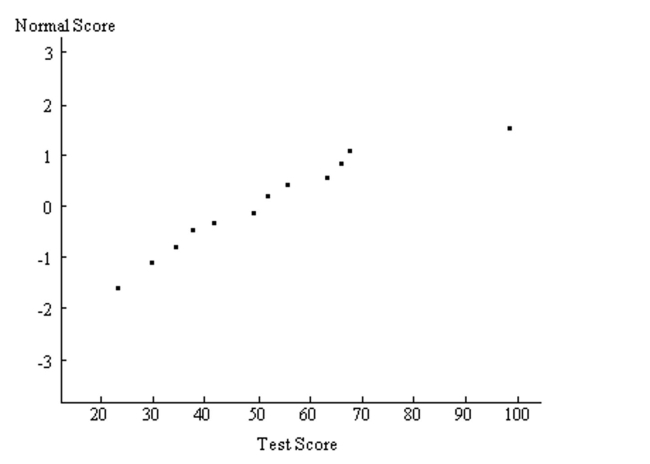
Correct Answer:
Verified
View Answer
Unlock this answer now
Get Access to more Verified Answers free of charge
Q210: Solve the problem.
-When sampling without replacement
Q211: Solve the problem.
-The numbers obtained on
Q212: Solve the problem.
-A final exam in Math
Q213: Solve the problem.
-In a population of 225
Q214: Solve the problem.
-A normal quartile plot is
Q216: Solve the problem.
-The probability of more than
Q217: Solve the problem.
-In a population of
Q218: Solve the problem.
-A final exam in Math
Q219: Solve the problem.
-For women aged 18-24, systolic
Q220: Solve the problem.
-A normal quartile plot is
Unlock this Answer For Free Now!
View this answer and more for free by performing one of the following actions

Scan the QR code to install the App and get 2 free unlocks

Unlock quizzes for free by uploading documents