Solve the problem.
-A normal quartile plot is given below for the weekly incomes (in dollars) of a sample of engineers in one town.
Use the plot to assess the normality of the incomes of engineers in this town. Explain your reasoning. 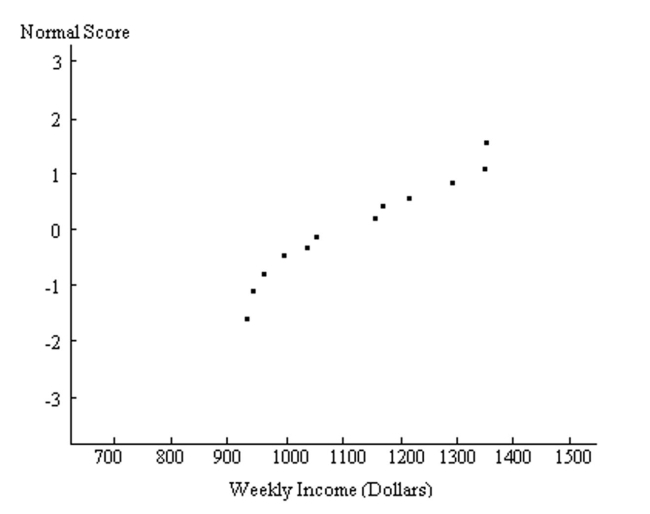
Correct Answer:
Verified
View Answer
Unlock this answer now
Get Access to more Verified Answers free of charge
Q215: Solve the problem.
-A normal quartile plot is
Q216: Solve the problem.
-The probability of more than
Q217: Solve the problem.
-In a population of
Q218: Solve the problem.
-A final exam in Math
Q219: Solve the problem.
-For women aged 18-24, systolic
Q221: Estimate the indicated probability by using the
Q222: Estimate the indicated probability by using the
Q223: For the binomial distribution with the given
Q224: Estimate the indicated probability by using the
Q225: Solve the problem.
-The probability of no more
Unlock this Answer For Free Now!
View this answer and more for free by performing one of the following actions

Scan the QR code to install the App and get 2 free unlocks

Unlock quizzes for free by uploading documents