A machine is supposed to fill boxes to a weight of 50 pounds. Every 30 minutes a sample of four boxes is tested; the results are given below.
What would be the value of the centerline that would be used in creating an R chart? 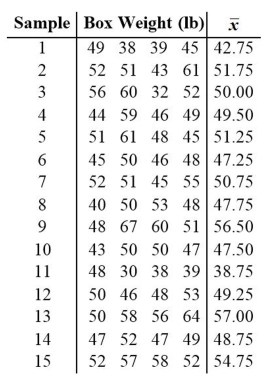
A) 11.000 pounds
B) 12.8000 pounds
C) 50 pounds
D) 49.567 pounds
Correct Answer:
Verified
Q53: Use the given process data to
Q54: A control chart for
Q55: Examine the given run chart or control
Q56: Examine the given run chart or control
Q57: A _ is a sequential plot of
Q59: Which type of chart would be
Q60: A run chart for individual values is
Q61: A machine is supposed to fill boxes
Q62: A machine that is supposed to fill
Q63: A machine that is supposed to fill
Unlock this Answer For Free Now!
View this answer and more for free by performing one of the following actions

Scan the QR code to install the App and get 2 free unlocks

Unlock quizzes for free by uploading documents