A run chart for individual values is shown below. Does there appear to be a pattern suggesting that the process
is not within statistical control? If so, describe the pattern. 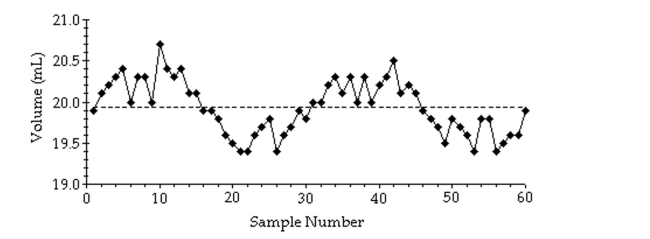
Correct Answer:
Verified
View Answer
Unlock this answer now
Get Access to more Verified Answers free of charge
Q55: Examine the given run chart or control
Q56: Examine the given run chart or control
Q57: A _ is a sequential plot of
Q58: A machine is supposed to fill boxes
Q59: Which type of chart would be
Q61: A machine is supposed to fill boxes
Q62: A machine that is supposed to fill
Q63: A machine that is supposed to fill
Q64: A control chart for
Q65: A machine is supposed to fill boxes
Unlock this Answer For Free Now!
View this answer and more for free by performing one of the following actions

Scan the QR code to install the App and get 2 free unlocks

Unlock quizzes for free by uploading documents