A control chart for is shown below. Determine whether the process mean is within statistical control. If it is
not, identify which of the three out-of-control criteria lead to rejection of a statistically stable mean. 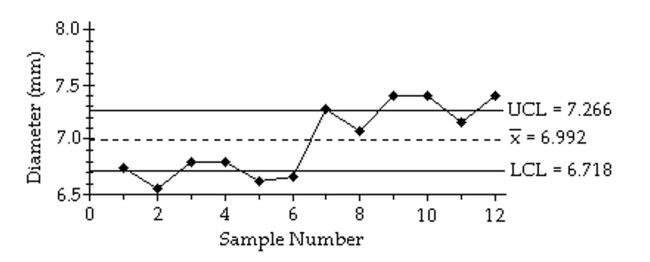
Correct Answer:
Verified
View Answer
Unlock this answer now
Get Access to more Verified Answers free of charge
Q59: Which type of chart would be
Q60: A run chart for individual values is
Q61: A machine is supposed to fill boxes
Q62: A machine that is supposed to fill
Q63: A machine that is supposed to fill
Q65: A machine is supposed to fill boxes
Q66: A control chart for monitoring variation
Q67: A run chart for individual values is
Q68: A machine is supposed to fill cans
Q69: A machine that is supposed to produce
Unlock this Answer For Free Now!
View this answer and more for free by performing one of the following actions

Scan the QR code to install the App and get 2 free unlocks

Unlock quizzes for free by uploading documents