A machine that is supposed to fill small bottles to contain 20 milliliters yields the following data from a test of 4 bottles every hour. What would be the centerline for a control chart for
? 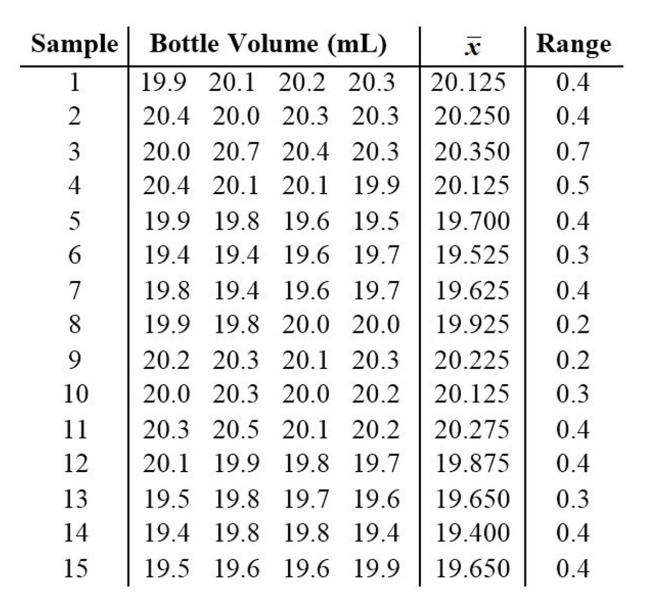
A) 19.935 milliliters
B) 0.380 milliliters
C) 20.000 milliliters
D) 20.212 milliliters
Correct Answer:
Verified
Q44: R charts are used to monitor _.
A)
Q45: Consider process data consisting of the
Q46: Use the given process data to
Q47: _ variation results from causes that can
Q48: A control chart for
Q50: Examine the given run chart or control
Q51: A manufacturer of lightbulbs picks 10
Q52: Which graph using individual data values
Q53: Use the given process data to
Q54: A control chart for
Unlock this Answer For Free Now!
View this answer and more for free by performing one of the following actions

Scan the QR code to install the App and get 2 free unlocks

Unlock quizzes for free by uploading documents