A control chart for s shown below. Determine whether the process mean is within statistical control. If it is
not, identify which of the three out-of-control criteria lead to rejection of a statistically stable mean. 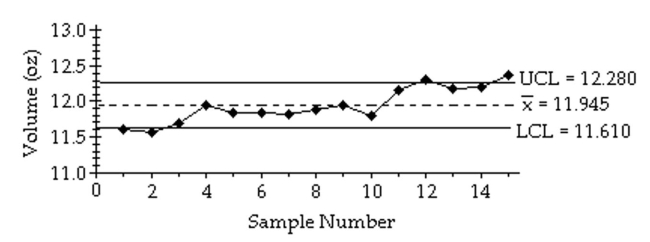
Correct Answer:
Verified
View Answer
Unlock this answer now
Get Access to more Verified Answers free of charge
Q43: The centerline for a control chart for
Q44: R charts are used to monitor _.
A)
Q45: Consider process data consisting of the
Q46: Use the given process data to
Q47: _ variation results from causes that can
Q49: A machine that is supposed to
Q50: Examine the given run chart or control
Q51: A manufacturer of lightbulbs picks 10
Q52: Which graph using individual data values
Q53: Use the given process data to
Unlock this Answer For Free Now!
View this answer and more for free by performing one of the following actions

Scan the QR code to install the App and get 2 free unlocks

Unlock quizzes for free by uploading documents