Use the following for questions
A sales manager was interested in determining if there is a relationship between college GPA and sales performance among salespeople hired within the last year. A sample of recently hired salespeople was selected and college GPA and the number of units sold last month recorded. Below are the scatterplot, regression results, and residual plots for these data. The regression equation is
Units Sold GPA
Analysis of Variance
Answer: 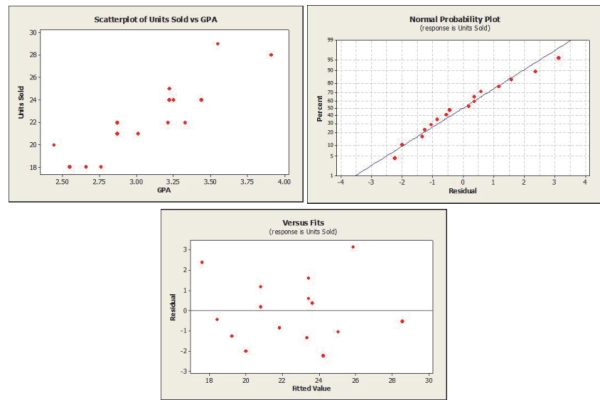
-What is the independent variable in this regression? Write the null and alternative
hypothesis to test the slope of this variable.
Correct Answer:
Verified
View Answer
Unlock this answer now
Get Access to more Verified Answers free of charge
Q12: Use the following information for questions
Nutritional
Q13: Use the following for questions
An
Q14: Use the following for questions
An
Q15: Use the following for questions
An
Q16: Use the following for questions
An
Q18: Use the following for questions
An
Q19: A sales manager was interested in determining
Q20: Use the following for questions
A
Q21: As the carbon content in steel
Q22: Consider Scatterplots 1 and 2 with fitted
Unlock this Answer For Free Now!
View this answer and more for free by performing one of the following actions

Scan the QR code to install the App and get 2 free unlocks

Unlock quizzes for free by uploading documents