Use the following for questions
An operations manager was interested in determining if there is a relationship between the amount of training received by production line workers and the time it takes for them to troubleshoot a process problem. A sample of recently trained line workers was selected. The number of hours of training time received and the time it took (in minutes) for them to troubleshoot their last process problem were captured. Below are the scatterplot, regression results, and residual plots for these data. The regression equation is
Trouble Shooting Training
Analysis of Variance
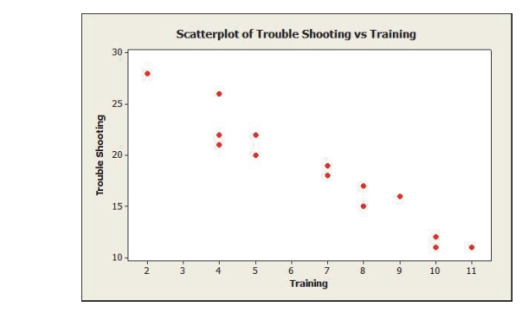
-Based on the scatterplot, what is the relationship between training and troubleshooting? Is a regression appropriate for this data? Why or why not?
Correct Answer:
Verified
View Answer
Unlock this answer now
Get Access to more Verified Answers free of charge
Q11: The following plots show (1) world population
Q12: Use the following information for questions
Nutritional
Q13: Use the following for questions
An
Q13: Consider the following to answer the question(s)
Q14: Use the following for questions
An
Q16: Use the following for questions
An
Q17: Use the following for questions
A
Q18: Use the following for questions
An
Q19: A sales manager was interested in determining
Q20: Use the following for questions
A
Unlock this Answer For Free Now!
View this answer and more for free by performing one of the following actions

Scan the QR code to install the App and get 2 free unlocks

Unlock quizzes for free by uploading documents