US public debt per capita historical data for the years 2009-2013 yields the following scatterplot: 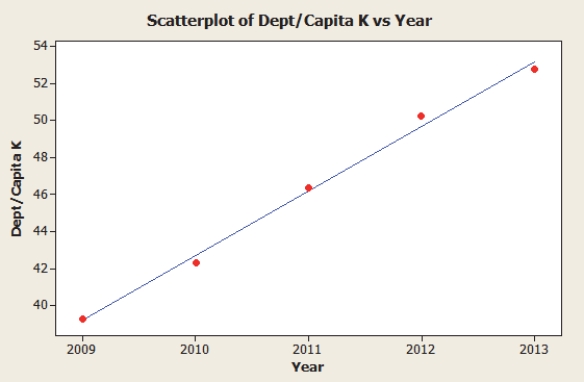 The equation of the regression line is predicted Debt per capita Debt Year with . Which of the following statements is true?
A) About 99.5% of the variability in debt per capita is explained by the model.
B) On average, debt per capita increases $3.49K per year.
C) The response variable is "year."
D) Both A and B.
E) All of the above.
Correct Answer:
Verified
Q20: A consumer research group investigating the relationship
Q21: Prices per share of the 20 most
Q23: Prices per share of the 20
Q24: A magazine that publishes product reviews
Q26: Real estate agencies keep track of housing
Q27: An advocacy group is investigating whether gender
Q29: A magazine that publishes product reviews
Q30: The following scatterplot shows monthly sales figures
Q112: A manufacturer of cable wire periodically selects
Q114: A manufacturer of cable wire periodically selects
Unlock this Answer For Free Now!
View this answer and more for free by performing one of the following actions

Scan the QR code to install the App and get 2 free unlocks

Unlock quizzes for free by uploading documents