The following scatterplot shows monthly sales figures (in units) and number of months of experience on the job for a sample of 19 salespeople. Estimate the correlation. 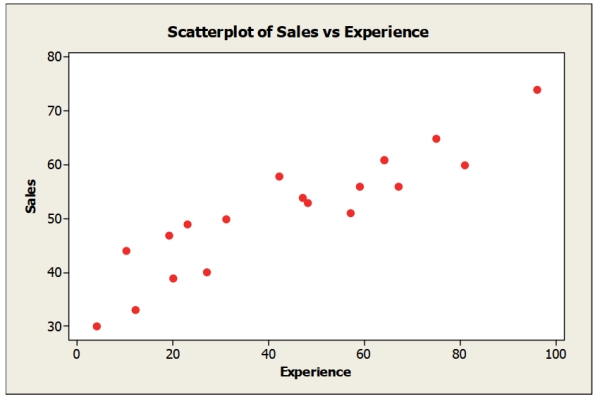
A) -0.3
B) +0.7
C) -0.7
D) +0.3
E) 0.0
Correct Answer:
Verified
Q25: US public debt per capita historical
Q26: Real estate agencies keep track of housing
Q27: An advocacy group is investigating whether gender
Q29: A magazine that publishes product reviews
Q33: An advocacy group is investigating whether
Q34: An office supply chain has stores in
Q35: For families who live in apartments the
Q88: In listing a property, real estate agencies
Q93: What scale of measurement is the type
Q114: A manufacturer of cable wire periodically selects
Unlock this Answer For Free Now!
View this answer and more for free by performing one of the following actions

Scan the QR code to install the App and get 2 free unlocks

Unlock quizzes for free by uploading documents