The following scatterplot shows monthly sales figures (in units) and number of months of experience on the job for a sample of 19 salespeople. Describe the association
Between monthly sales and level of experience. 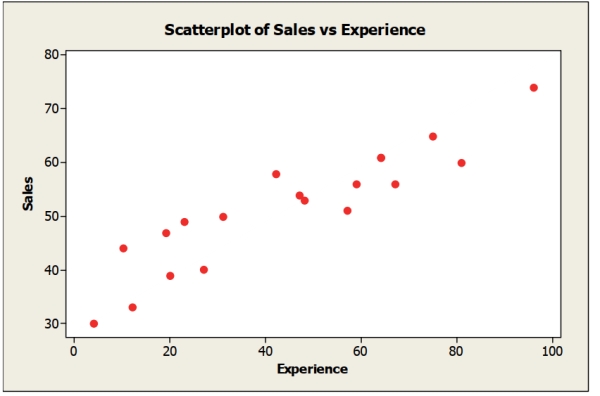
A) Wear negative linear association
B) Moderate positive linear association
C) Moderate negative linear association
D) Weak positive linear association
E) Non-linear
Correct Answer:
Verified
Q11: Consider the following to answer the question(s)
Q35: For families who live in apartments the
Q36: A consumer research group investigating the relationship
Q37: A magazine that publishes product reviews
Q38: A business researcher conducted a survey
Q39: Which is true of the data shown
Q41: Suppose a sample of 60 business majors
Q42: Below is a stem and leaf
Q43: A regression analysis of company profits and
Q44: A consumer research group investigating the relationship
Unlock this Answer For Free Now!
View this answer and more for free by performing one of the following actions

Scan the QR code to install the App and get 2 free unlocks

Unlock quizzes for free by uploading documents