Following is a time series graph for monthly closing price for the Dow Jones
Industrial Average (beginning March 2003). 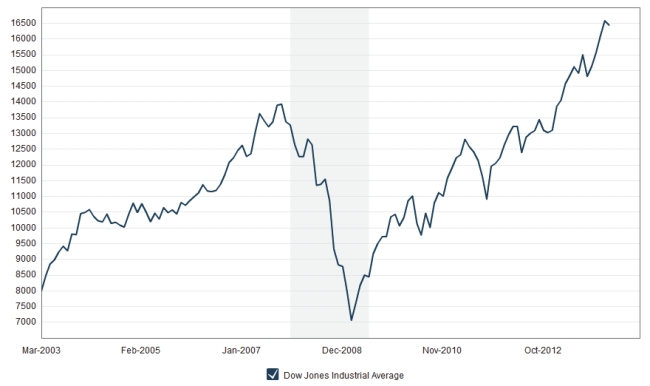
A. Are the closing prices for the Dow Jones Average from October 2004 through
December 2006 fairly stationary? Explain.
b. What was the most volatile period of time for the Dow Jones average? Explain.
c. Would a histogram provide a good summary of these stock prices? Explain.
Correct Answer:
Verified
View Answer
Unlock this answer now
Get Access to more Verified Answers free of charge
Q14: Following is the five-number summary of
Q15: Below is a histogram of salaries (in
Q16: Data were collected on the hourly wage
Q17: The following boxplots show the closing share
Q18: The following table shows data for total
Q20: Here is the five number summary
Q21: Consider the five number summary of
Q22: The following boxplots show the closing share
Q23: The following table shows total assets
Q24: Consider the five number summary of
Unlock this Answer For Free Now!
View this answer and more for free by performing one of the following actions

Scan the QR code to install the App and get 2 free unlocks

Unlock quizzes for free by uploading documents