The following boxplots show the closing share prices for a sample of technology companies on the first trading days in August 2007 and in August 2002. Which of the
Following statement is true? 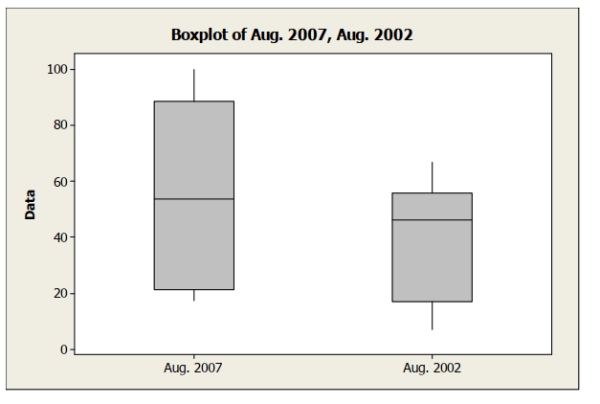
A) The median closing share price is higher in August 2007 compared to August 2002.
B) Closing prices are more variable in August 2007 compared to August 2002.
C) The distribution of closing prices in August 2007 appears more symmetric than the
Distribution of closing prices in August 2002.
D) Both A and B.
E) All of the above.
Correct Answer:
Verified
Q17: The following boxplots show the closing share
Q18: The following table shows data for total
Q19: Following is a time series graph for
Q20: Here is the five number summary
Q21: Consider the five number summary of
Q23: The following table shows total assets
Q24: Consider the five number summary of
Q25: The following boxplots show monthly sales revenue
Q26: Consider the five number summary of
Q27: Consider the five number summary of
Unlock this Answer For Free Now!
View this answer and more for free by performing one of the following actions

Scan the QR code to install the App and get 2 free unlocks

Unlock quizzes for free by uploading documents