Following is a time series graph for monthly closing price for the Dow Jones Industrial Average (beginning March 2003) . Which of the following statements is true? 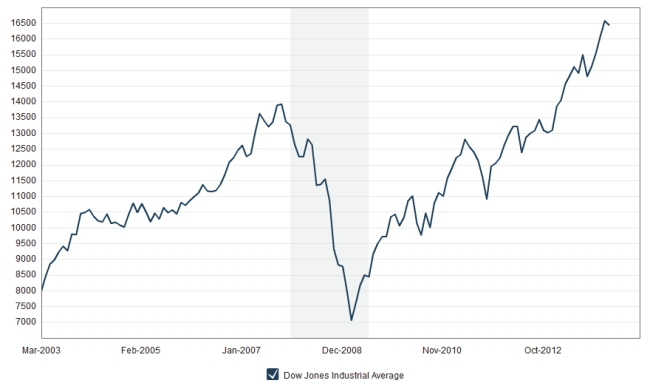
A) A histogram would provide a good representation of these data.
B) The data show an upward trend since late 2008.
C) The data show a 50% drop in the Dow Jones Average by the end of 2008.
D) Both A and C.
E) Both B and C.
Correct Answer:
Verified
Q11: The ASQ (American Society for Quality) regularly
Q22: The following boxplots show the closing share
Q23: The following table shows total assets
Q24: Consider the five number summary of
Q25: The following boxplots show monthly sales revenue
Q26: Consider the five number summary of
Q27: Consider the five number summary of
Q28: The following table shows total assets
Q30: Data were collected on the hourly wage
Q32: The following table shows total assets
Unlock this Answer For Free Now!
View this answer and more for free by performing one of the following actions

Scan the QR code to install the App and get 2 free unlocks

Unlock quizzes for free by uploading documents