The following graph shows the marginal cost (MC) and marginal benefit (MB) of holding real money balances. The market is initially in equilibrium at £100. Refer to the graph to answer the question. 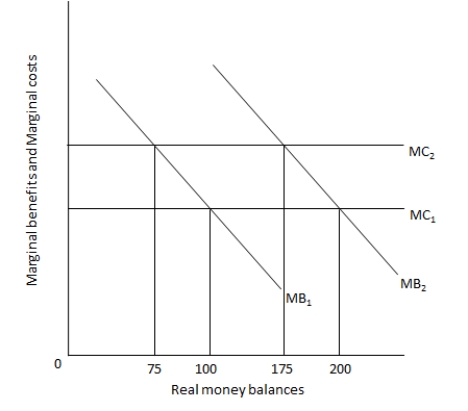 Suppose marginal cost increases to MC2 but marginal benefit remains unchanged. The new equilibrium level of real money balances will:
A) be equal to £75.
B) be equal to £175.
C) be equal to £200.
D) remain the same, at £100.
Correct Answer:
Verified
Q20: _ is the broadest measure of money
Q21: The following graph shows the marginal cost
Q22: How does a central bank control the
Q23: If there was a decrease in national
Q24: An individual demands money because he thinks
Q26: The _ for holding money explains why
Q27: Suppose the 'helicopter option' is implemented and
Q28: Which of the following is true of
Q29: If the supply of money increased while
Q30: Which of the following correctly describes the
Unlock this Answer For Free Now!
View this answer and more for free by performing one of the following actions

Scan the QR code to install the App and get 2 free unlocks

Unlock quizzes for free by uploading documents