The following graph shows the marginal cost (MC) and marginal benefit (MB) of holding real money balances. The market is initially in equilibrium at £100. Refer to the graph to answer the question. 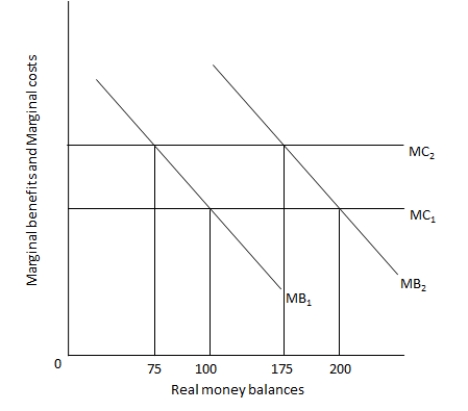 Suppose the interest rate on bonds increases. Other things remaining the same, which of the following is true?
A) The new equilibrium level of real money balances will be equal to £175.
B) The marginal cost line will move from MC1 to MC2.
C) The new equilibrium level of real money balances will be equal to £200.
D) The marginal benefit line will move from MB1 to MB2.
Correct Answer:
Verified
Q16: The amount of notes and coins in
Q17: Which of the following is included in
Q18: Which of the following statements is true
Q19: Minimum reserve requirements stipulate:
A) the value of
Q20: _ is the broadest measure of money
Q22: How does a central bank control the
Q23: If there was a decrease in national
Q24: An individual demands money because he thinks
Q25: The following graph shows the marginal cost
Q26: The _ for holding money explains why
Unlock this Answer For Free Now!
View this answer and more for free by performing one of the following actions

Scan the QR code to install the App and get 2 free unlocks

Unlock quizzes for free by uploading documents