In the following graph, MPC and MSC represent the marginal private cost and marginal social cost of producing a good respectively. QD represents the demand for the good. Refer to the graph to answer the question. 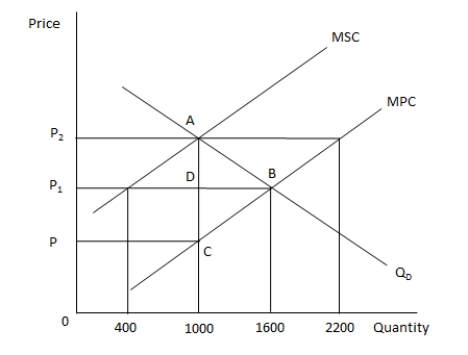 The socially optimum level of output is _____ of the good.
A) 400 units
B) 1000 units
C) 1600 units
D) 2200 units
Correct Answer:
Verified
Q22: Which of the following could create a
Q23: In the following graph, MPC and MSC
Q24: Under a performance contract, a dentist would
Q25: An externality exists in the production of
Q26: If either consumers or producers have incomplete
Q28: Which of the following is likely to
Q29: Which of the following is true of
Q30: Market failure is likely in markets that:
A)
Q31: In the following graph, MPC and MSC
Q32: Which of the following is true of
Unlock this Answer For Free Now!
View this answer and more for free by performing one of the following actions

Scan the QR code to install the App and get 2 free unlocks

Unlock quizzes for free by uploading documents