In the following graph, MPC and MSC represent the marginal private cost and marginal social cost of producing a good respectively. QD represents the demand for the good. Refer to the graph to answer the question. 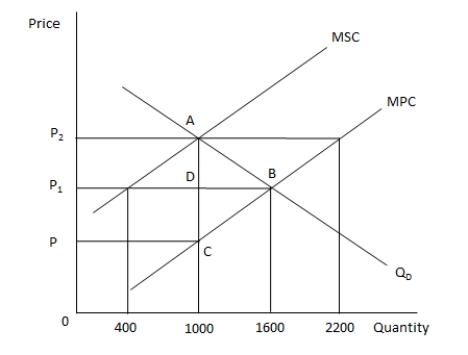 Which of the following statements is true?
A) The MPC of production is greater than the MSC of producing the good.
B) The quantity of the good produced in the market will be higher than the socially optimal
C) For the market to produce the socially optimal level of output, the government should provide a subsidy.
D) There is a positive externality associated with the production and consumption of this
Correct Answer:
Verified
Q18: How might an employer reduce the agency
Q19: According to _, managers use the company's
Q20: The costs of _ are termed agency
Q21: When a good generates a negative externality
Q22: Which of the following could create a
Q24: Under a performance contract, a dentist would
Q25: An externality exists in the production of
Q26: If either consumers or producers have incomplete
Q27: In the following graph, MPC and MSC
Q28: Which of the following is likely to
Unlock this Answer For Free Now!
View this answer and more for free by performing one of the following actions

Scan the QR code to install the App and get 2 free unlocks

Unlock quizzes for free by uploading documents